Competing In and Winning the APIC's 2023 Energy Hackathon
TAGS: software; hackathon; Python; Alberta Power Industry Consortium
Why I Did This
Hackathons are great place to: brainstorm project ideas; meet other innovators; get some recognition and prize money. This hackathon was hosted at my university by the Alberta Power Industry Consortium, with the theme being centered around: Safety and Security for the Smart Grid, System Modelling and Artificial Intelligence for Power Systems, Grid Integration of Renewable and Distributed Energy, and Advanced Power Electronics for the Smart Grid. I love electrical-based projects so I figured this hackathon would be great for me.
The title of our chosen topic.
We wanted to explore the potential of advancing
monitoring systems on small energy generation systems.
BDJW was our team name.
Design Walkthrough
At the beginning of the hackathon, we were presented with a workshop focused on a neat free
(for basic use) python platform that can present python data apps over a web server; it was
call Plotly dash. The workshop demo showed us how to create basic webpage that displayed a
line chart of API supplied statistical data (if I recall correctly it, was around countries’
energy production stats); My teammate, Darren, had the fantastic idea of integrating the
Alberta AESO data (Alberta’s electrical grid historical and current purchase prices) into
our own web application. Our team further developed the idea to create a web dashboard for
municipal energy systems (like solar systems, wind farms, etc.) that would act a ‘open’
proxy dashboard for private systems (since typically private energy systems have their own
private dashboards to cater to their own private instruments) so that we could monitor that
systems current outputs/settings, and integrate it with current/historical AESO data to make
recommendation algorithm for deciding when to keep or sell any produce power back to the
grid.
We further thought about how we could expand this algorithm to be smarter (more AI like) by
capturing historical personal system data, analyzing it with AESO data, to better recommend
a system’s selling/storing options.
Given that the hackathon only lasts ~2 days, we developed what we could for the dashboard
and presented it along with ideas for expansion.
Our wonderful team presented so beautifully that we won first place for ideas, and first
place for presentation abilities. Congrats and thank you again to teammates Darren, Jaime,
and Warren!
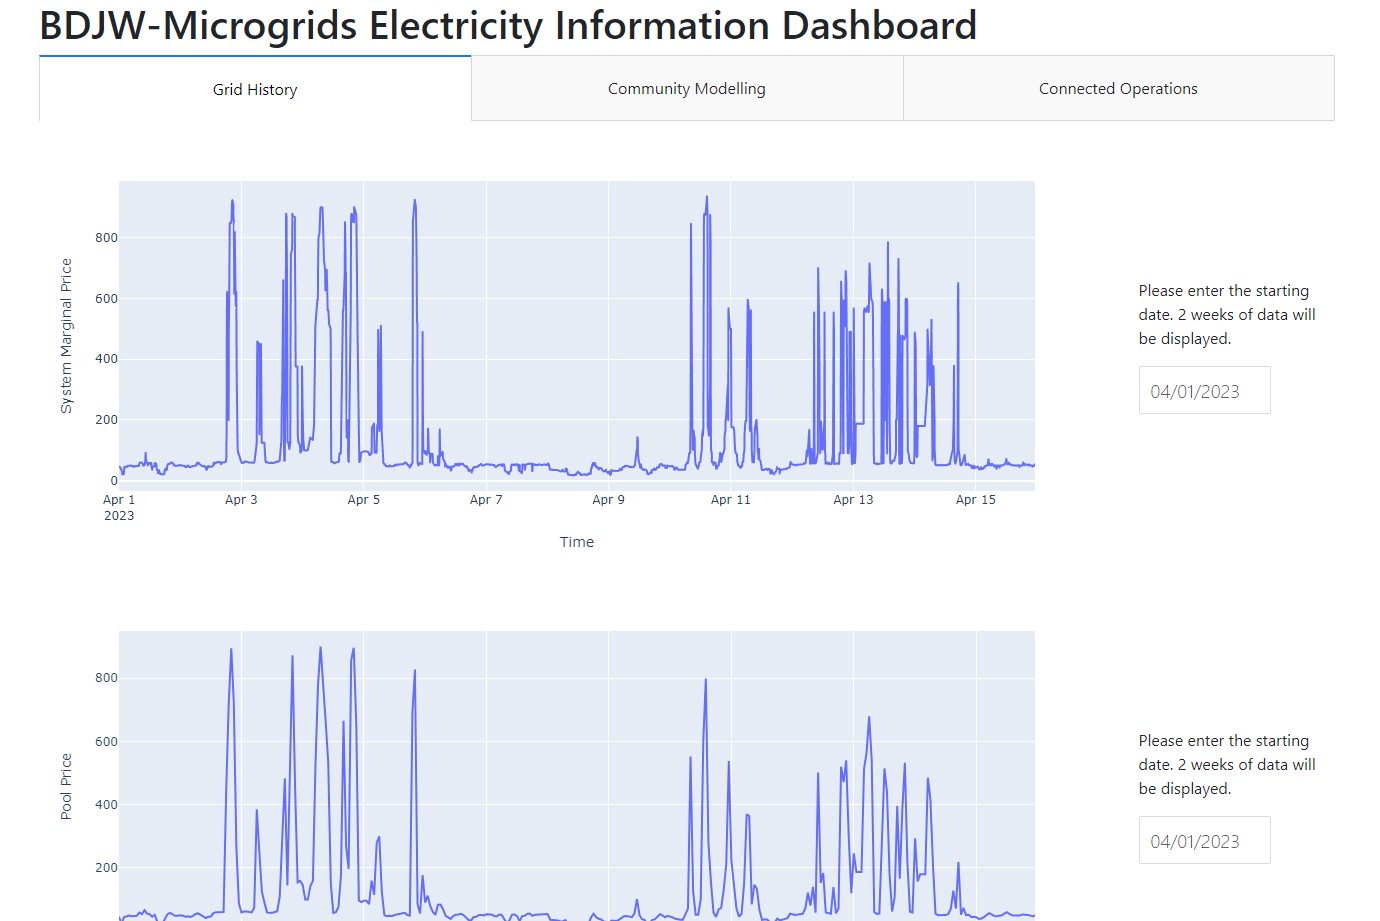
Our app would incorporate historical and current Alberta grid prices.
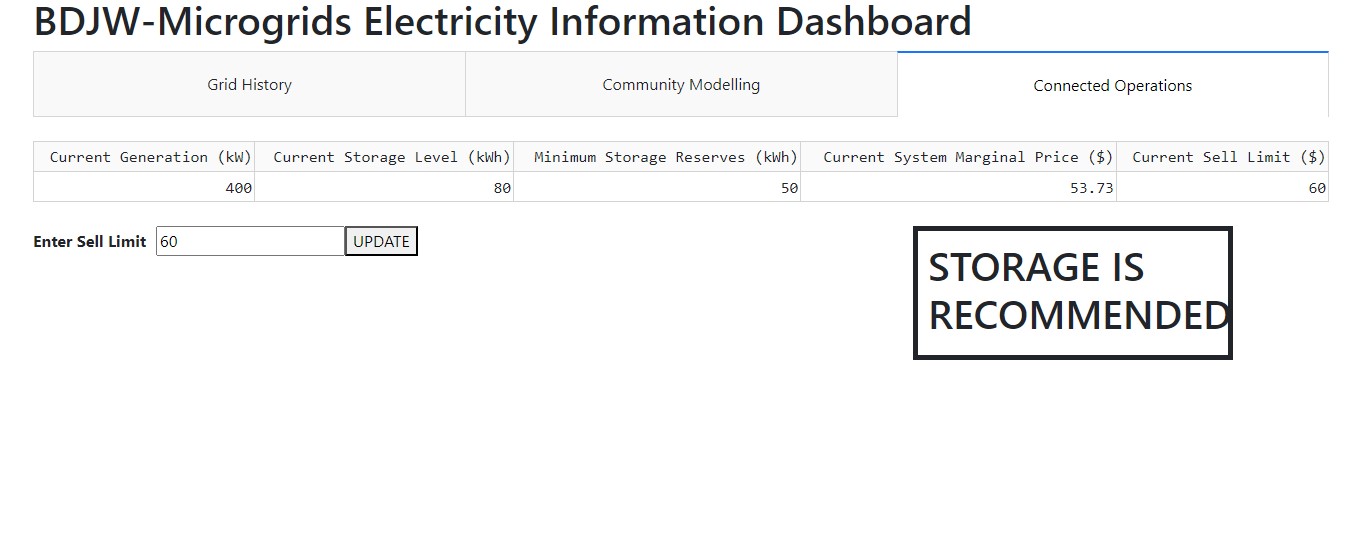
The app would monitor current energy outputs and use the grid prices and an algorithm
to determine recommended selling patterns (similar to a stock trading system).
At the time, it was only the static price differences (between current price and
desired sell price) used to make recommendations, but we wanted to expand this to
include
historical data to make a more dynamic algorithm.
Lessons Learned and Future Changes
Is there potential to test? Our university has a Renewable Energy Design (RED) student club that houses a solar panel storage system in conjunction with a greenhouse and garden. It might be a cool idea to setup this software for that system (even though we aren’t hooked up to the Alberta electrical grid) if we can get our panel’s sensors to work with it; maybe a raspberry pi might help?References
APIC hackathon website:
https://www.apicweb.ca/hackathon-23/
Plotly dash service: https://plotly.com/dash/